


Nearly 100 years of data say this month is different. This year it comes with real tests.
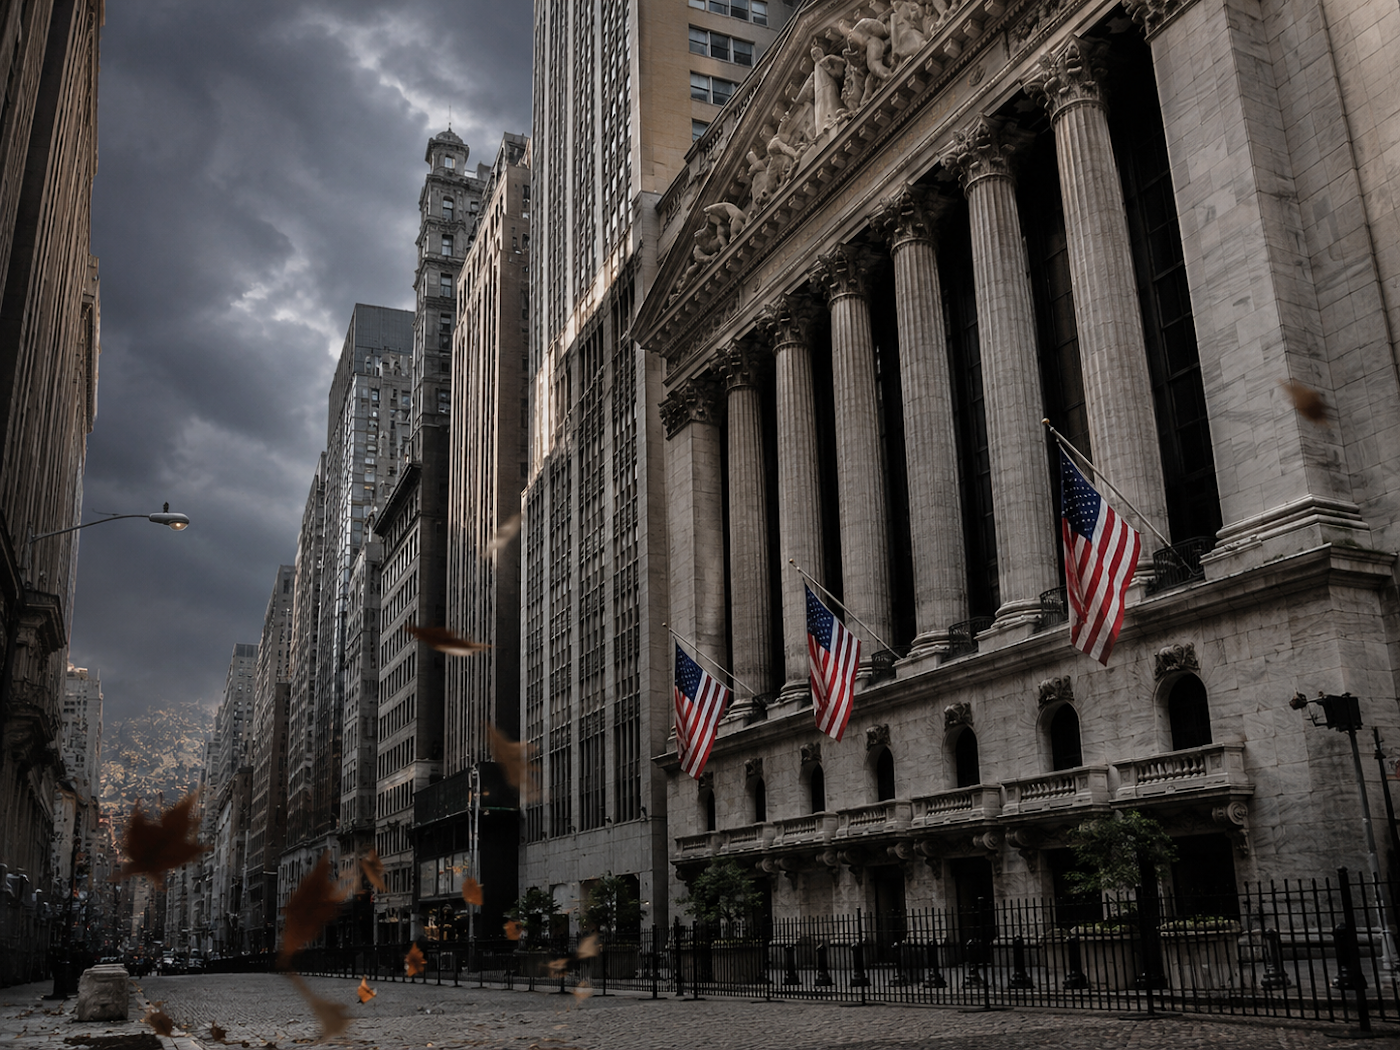
Markets are closed for Labor Day. So today we step back for a quick history lesson. Traders grumble about September. They fear October. There is a good reason for both. Seasonality does not drive markets on its own. But history shows these two months punch above their weight.
There's a Strategy Behind the Iran War.
I know because I've seen the evidence firsthand.
On March 2nd — three days after the first missiles hit — I sat across from two U.S. Congressmen in back-to-back private meetings.
Those meetings pointed me toward something I spent weeks verifying.
The real purpose behind the strikes. The real objective. And the single company at the dead center of all of it.
This isn't random. It's a calculated Two-Front Economic War.
And there's one company positioned right at the heart of it.
See the strategy behind the Iran war — and the company at the center of it
The sooner you understand what's really happening — the better positioned you'll be before
— Dylan Jovine, Founder, Behind the Markets
September: The Market's Weakest Month
September has the worst track record on the calendar. Going back to 1928, S&P data shows it averages the weakest returns of any month. Traders call it the September Effect. Nobody fully agrees on why. Some point to tax-loss selling by mutual funds. Others point to rebalancing after summer.
The record speaks for itself. In 1931, deep in the Great Depression, U.S. stocks fell nearly 30% in September alone. In 1974, inflation, an oil shock, and recession fears drove a 12% drop. After 9/11 in 2001, the S&P 500 lost 8% for the month. Then came September 2008. Lehman failed, and a seasonal soft spot became a systemic shock. Stocks fell 9%.
Brutal Septembers
| Year | Event | U.S. Equity Decline |
| 1931 | Great Depression collapse | -30% |
| 1974 | Inflation + oil shock | -12% |
| 2001 | Post-9/11 downturn | -8% |
| 2008 | Lehman bankruptcy | -9% |
October: Crashes and Bottoms
If September grinds, October jolts. The most famous jolt came in 1929. The Dow fell 13% on October 28 and another 12% the next day. The Great Depression followed. On October 19, 1987, Black Monday, the Dow dropped 22% in one session. That is still the steepest one-day percentage drop on record. In October 2008, the financial crisis hit full force. The S&P 500 lost 17% that month.
But October also ends bear markets. The 2002 bear market bottomed on October 9. The 2011 correction bottomed on October 3. Both set up multi-year rallies. Traders call October the bear killer. It forces a reckoning, flushes out excess, and resets the tape.
Infamous Octobers
| Year | Event | U.S. Equity Decline |
| 1929 | Great Depression begins | -23% (two days) |
| 1987 | Black Monday | -20.5% (one session) |
| 2008 | Financial crisis escalation | -17% |
| 2018 | Rate-hike + growth scare | -7% |
Free Stock Pick: The Company First in Line
for America’s New Super Fuel
The U.S. Army and Department of Energy are about to flip the switch on a revolutionary new fuel — and one obscure defense contractor has a five-year head start on every competitor.
This joint, high-priority initiative — ordered by President Trump — is called Project Janus.
And the first powerplant to run this new fuel is expected to go live before December 18, 2026…
When it does, this company’s name will be everywhere.
Full details — including the name and ticker symbol — are being revealed for free.

Click HERE to get the stock name, ticker, and the full Project Janus story for free.
This Year's Calendar Is Loaded
It is tempting to assume September weakness will replay on schedule. Treat seasonality as a backdrop, not a forecast. What matters is the calendar in front of us, and this one is heavy.
The August jobs report landed Friday. Producer prices hit Thursday, September 10. CPI follows Friday, September 11. Those are the last major inflation readings before the Fed meets September 15 and 16. The rate decision lands Wednesday afternoon, with fresh projections and a press conference. Retail sales print that same morning.
The debate has shifted. The question is no longer how fast the Fed can ease. It is whether sticky inflation, higher energy costs, and a still-solid economy force policy to stay tight, or get tighter. The answer reaches well beyond the funds rate.
Earnings add a second test. Oracle and Adobe report on enterprise tech spending and AI monetization. FedEx offers a read on global trade and shipping demand. Later in the month, Costco shows how the consumer is holding up. Micron puts the AI-driven memory cycle back under the microscope.
Satellite Confirms: Elon Musk Activating Strange 'Dark Energy' Across U.S. South

Confirmed by satellites 300 miles above the Earth's surface... Elon Musk is rolling out a breakthrough technology that could replace our need for foreign oil and ignite a $10 trillion boom a small group of stocks. Click here to learn how you can invest in this before it becomes mainstream.
What the Market Is Assuming
Treasury yields are the pressure point. The 10-year yield recently approached 4.8%. That raises borrowing costs and squeezes stock valuations. This market has kept rewarding long-duration growth stocks and AI names. A sustained move higher in yields would test that trade harder than any calendar effect.
Iran adds a feedback loop. Renewed fighting between the United States and Iran has pushed oil sharply higher. It has revived worries about flows through the Strait of Hormuz. Higher oil complicates the inflation picture. Stickier inflation can push yields and Fed expectations higher. The geopolitical story and the rates story now feed each other.
All of this hits a market with big assumptions priced in. Investors assume AI spending stays durable. They assume earnings keep growing. They assume the consumer absorbs higher prices. They assume higher rates will not derail the economy. September will produce evidence on nearly all of it.
ICE. The Epstein Files. Tariffs.
That’s what the media wants you to focus on.
But behind the scenes, it seems President Trump is quietly preparing something far more shocking — that will leave even his most loyal MAGA patriots stunned.
It’s NOT being debated on cable news or on X.
But it could make you enormously rich in the second half of 2026.
Final Thoughts
September has earned its reputation. But history does not say whether stocks rise or fall over the next four weeks. It says markets get less forgiving when uncertainty piles up. This year, there is plenty of it.
The watchlist is clear: inflation, the Fed, oil, Iran, Treasury yields, and earnings. If inflation cools, oil settles, yields ease, and earnings hold, the September Effect stays a footnote. If those forces break the other way, seasonality gets reinforced by something stronger: a real repricing of growth, inflation, and rate expectations.
That is the real lesson from market history. September does not cause corrections. October does not cause crashes. Markets get vulnerable when expectations, positioning, and fundamentals fall out of line. The calendar just has a habit of surfacing those tensions.
History gives the warning. The next few weeks give the evidence.
Have a wonderful Labor Day. We'll be back tomorrow with our regularly scheduled programming.
FREE MARKET ALERTS
Know What’s Moving the Market Before You Miss the Move
Get market-moving news, analyst trade ideas, and key catalysts delivered directly to your phone so you can spot opportunities faster.
